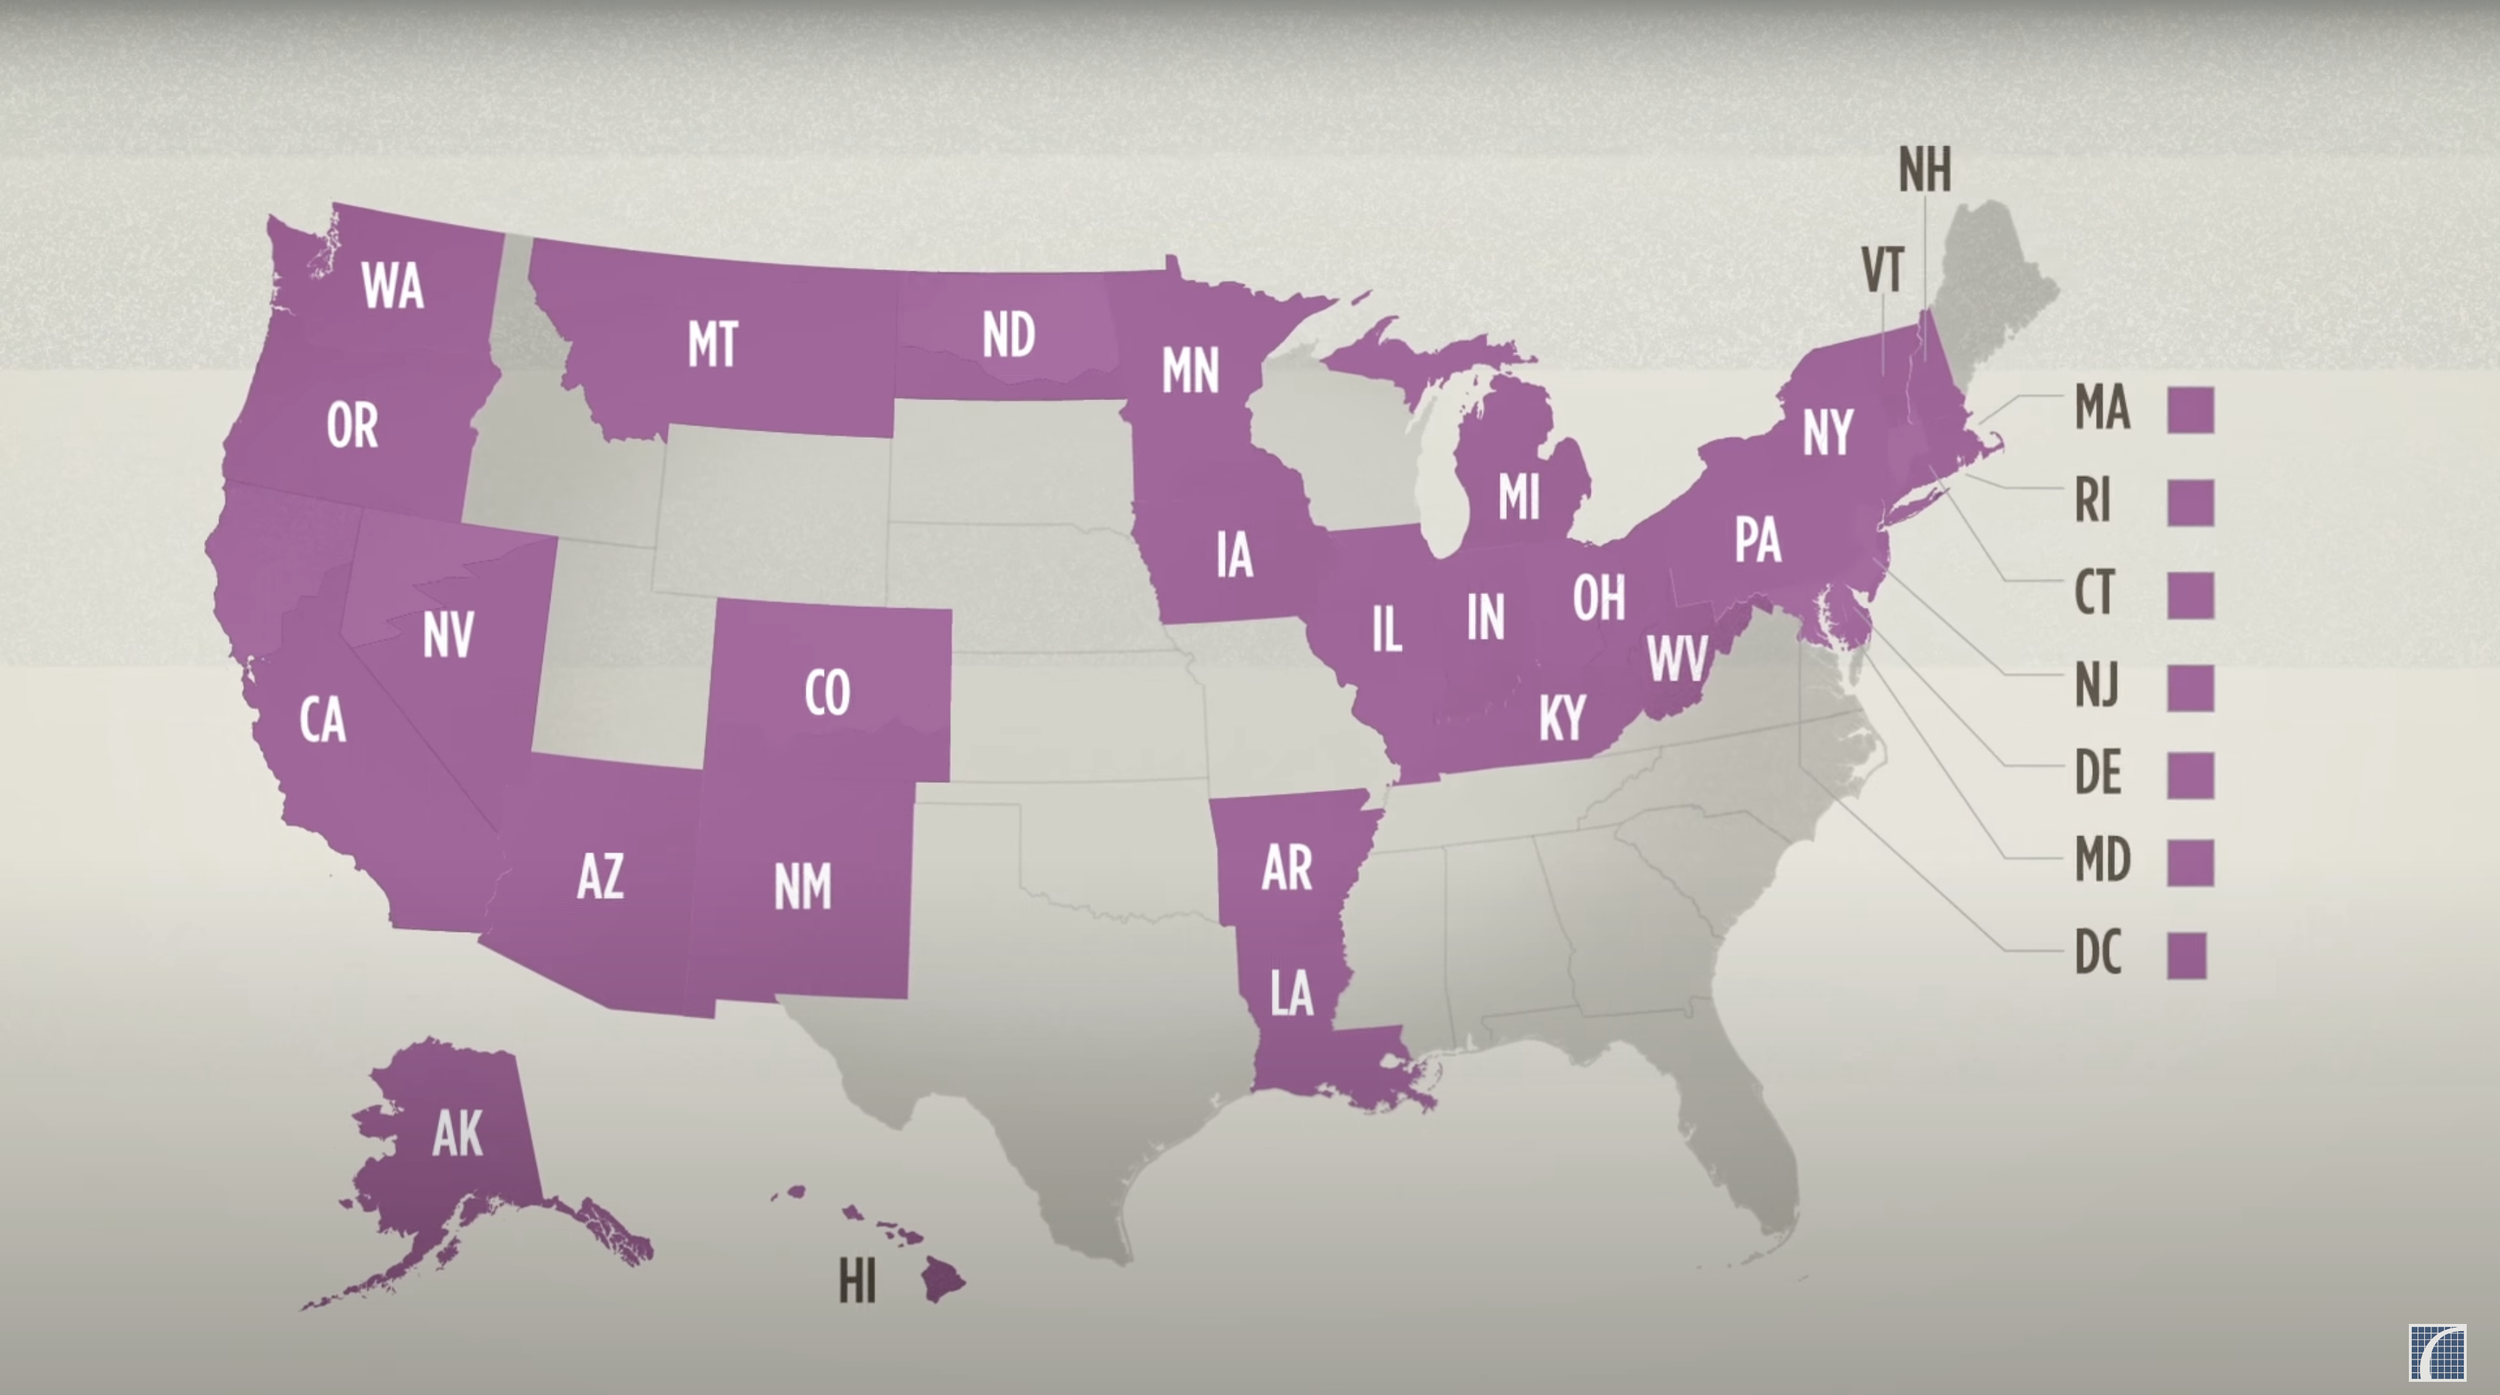
Understanding Medicaid Expansion
A motion graphic video and two information graphics to help people understand the effects of Medicaid expansion in their state and country as a whole.
Skills: Storyboarding, data visualization, typography, illustration
For the motion graphic video, I collaborated with a team at Graphicacy, created a cast of characters to represent a variety of typical American workers and followed one of them, “Jane,” in the video to show how all of this mattered to a relatable individual in their daily life. The video was helpful in quickly explaining what an insurance coverage gap means, why it exists, how it impacts the lives of everyday people and the benefits of expanding Medicaid with some simple charts and graphs to validate the message.


The client, Center on Budget and Policy Priorities, wanted to create a companion set of state-specific infographics – short blocks of text paired with an illustration or chart that were knitted together into a simple narrative. These elements were created in a modular way so they could be mixed, matched, and lightly edited for each state in the outreach effort.


